CartoDB Visualizations
One Data Set Four Ways
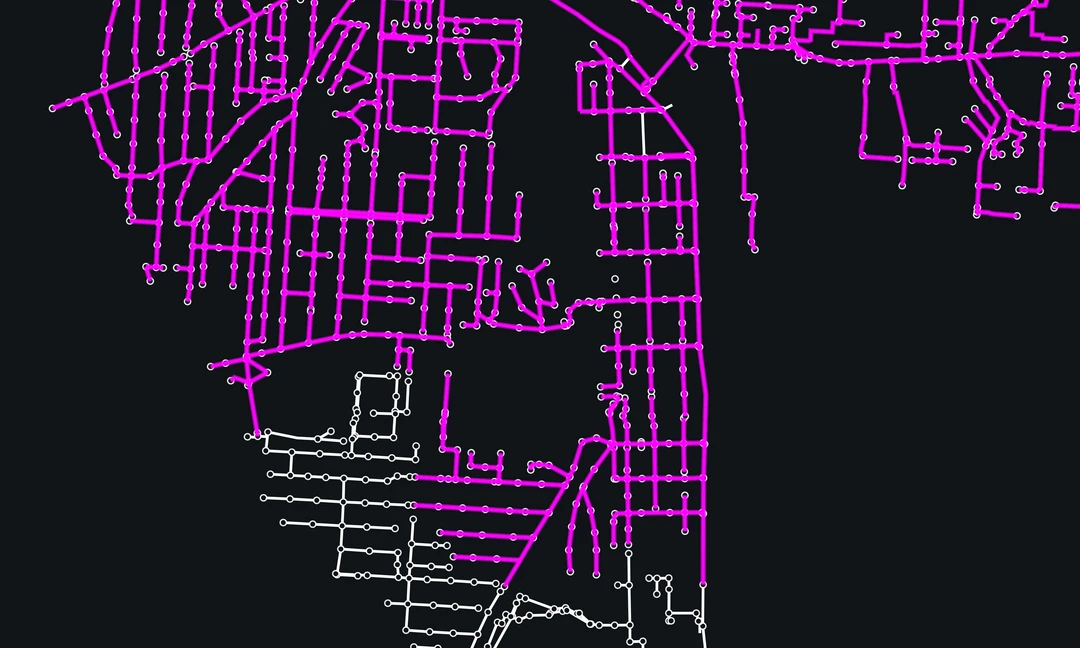
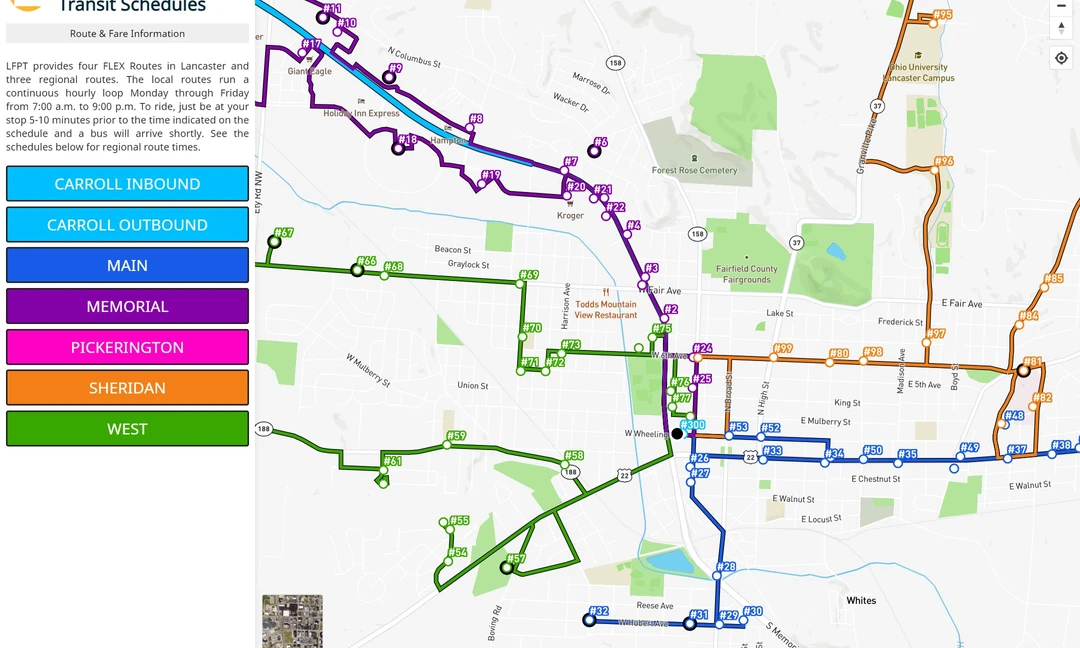
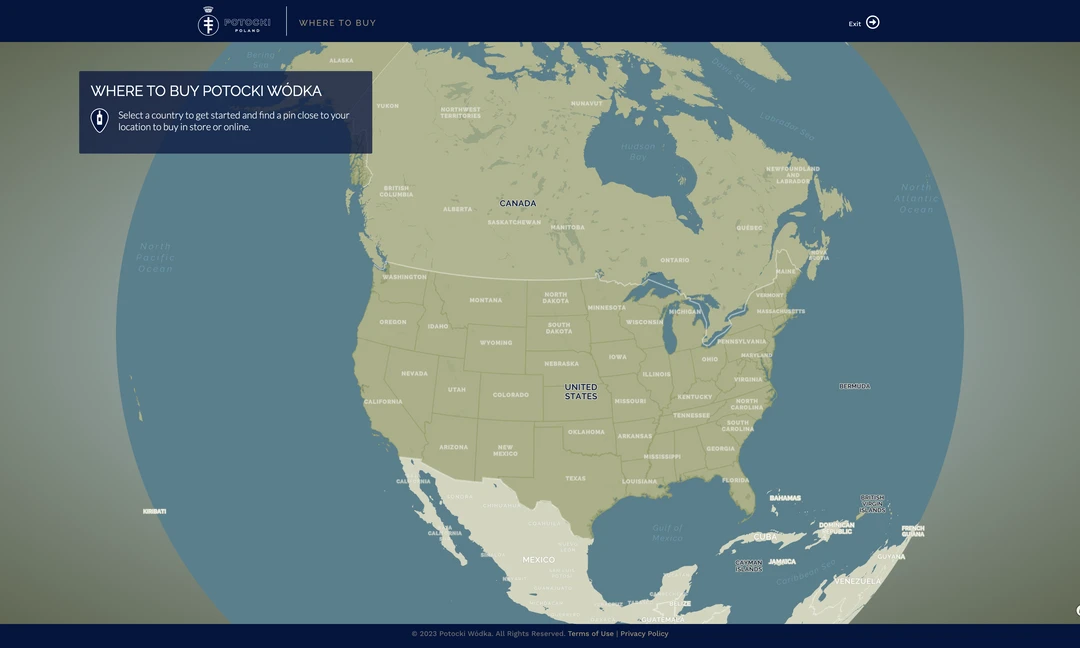
The maps above use the same data set, visualized using four different map types in the CartoDB web interface. The torque map in the header uses the feature id for the time variable so it serves no analytic purpose, but it makes for a nice effect.


