Deck GL and 3D Tiles
Generate Colorized 3D Tiles from LiDAR and Ortho Imagery

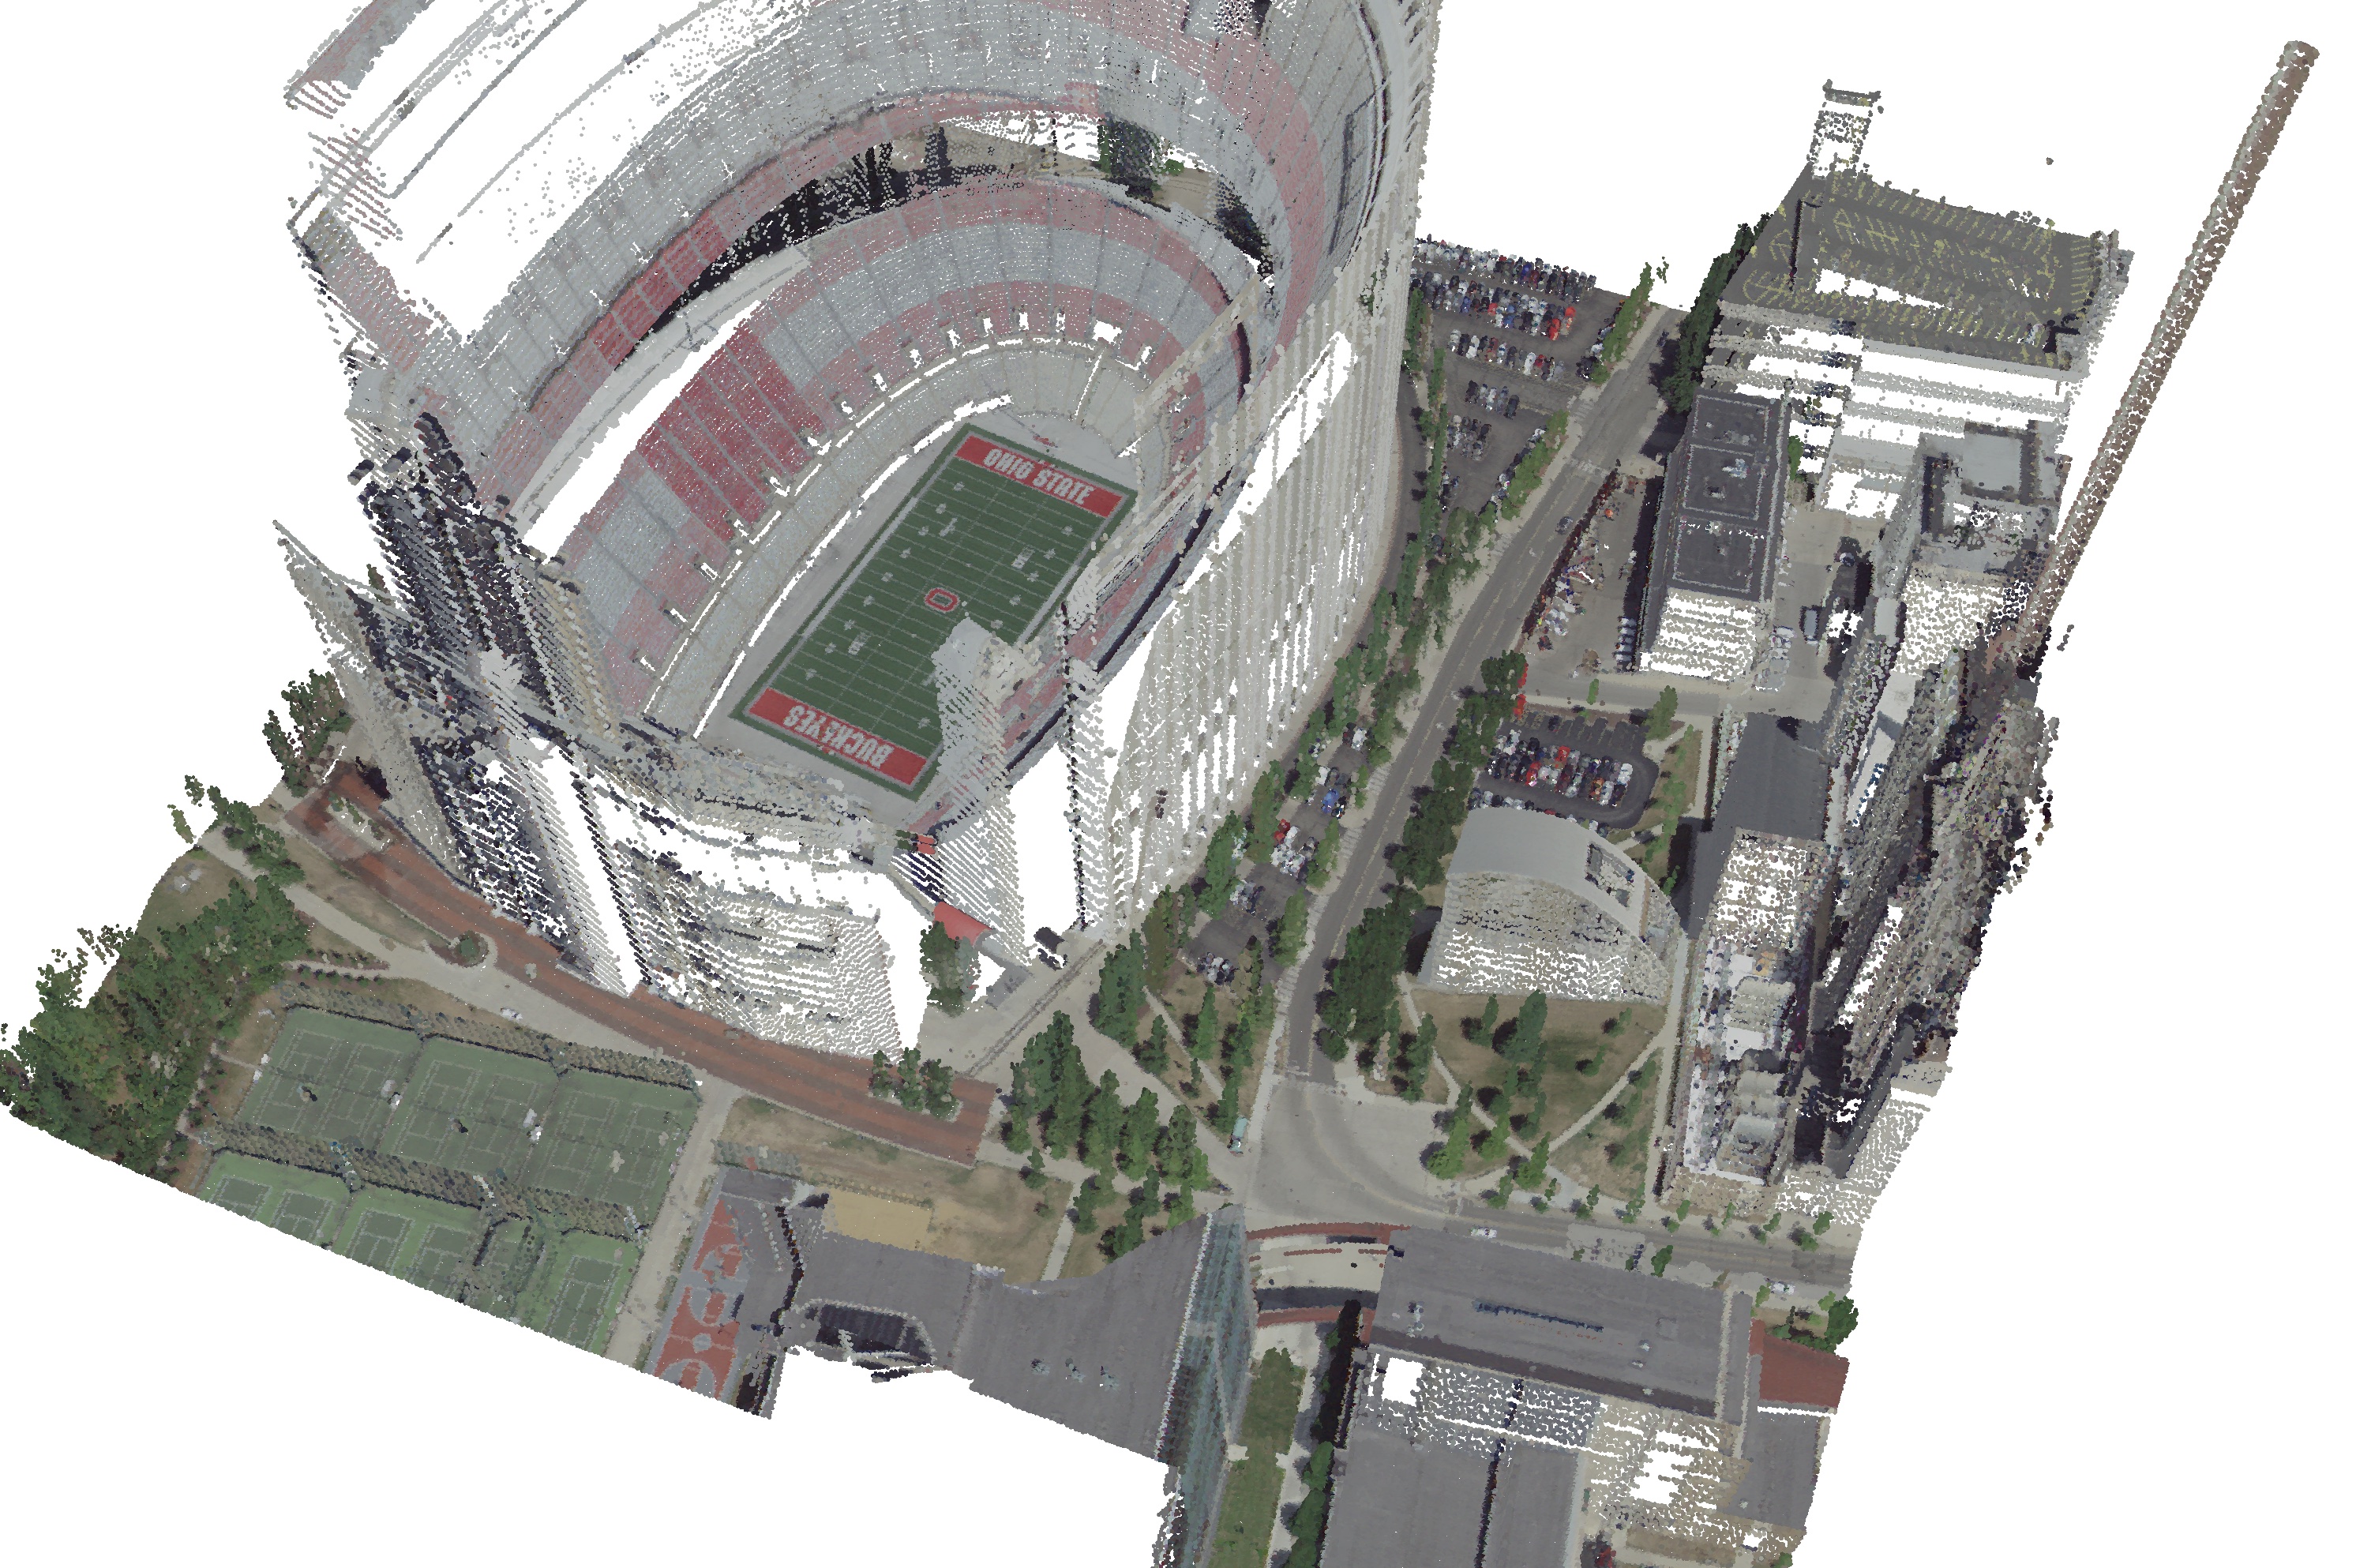
This post walks you through the process of creating colorized 3D Tiles suitable for displaying on a web map from LiDAR and ortho imagery. For this example we will use LiDAR from the Elevation Source Data (3DEP) - Lidar, IfSAR dataset, high-resolution ortho imagery from Ohio’s open imagery program, and the command-line geospatial tools pdal, gdal, and gocesiumtiler.
To get started, download and install PDAL and gocesiumtiler:
Instructions for macOS, for other operating systems refer to the respective documentation.
PDAL Installation:
- Open Terminal and install PDAL using Homebrew:
brew install pdal
- Open Terminal and install PDAL using Homebrew:
gocesiumtiler Installation:
- Install Go using the default installer or homebrew:
brew install go - Clone the gocesiumtiler repository from GitHub:
git clone https://github.com/mfbonfigli/gocesiumtiler - Navigate to the repository directory:
cd gocesiumtiler - Build the CLI executable:
go build -o gocesiumtiler ./cmd/main.go
- Install Go using the default installer or homebrew:
Next we need to download the data. In this example we will use data for the Ohio Buckeye’s famous stadium.
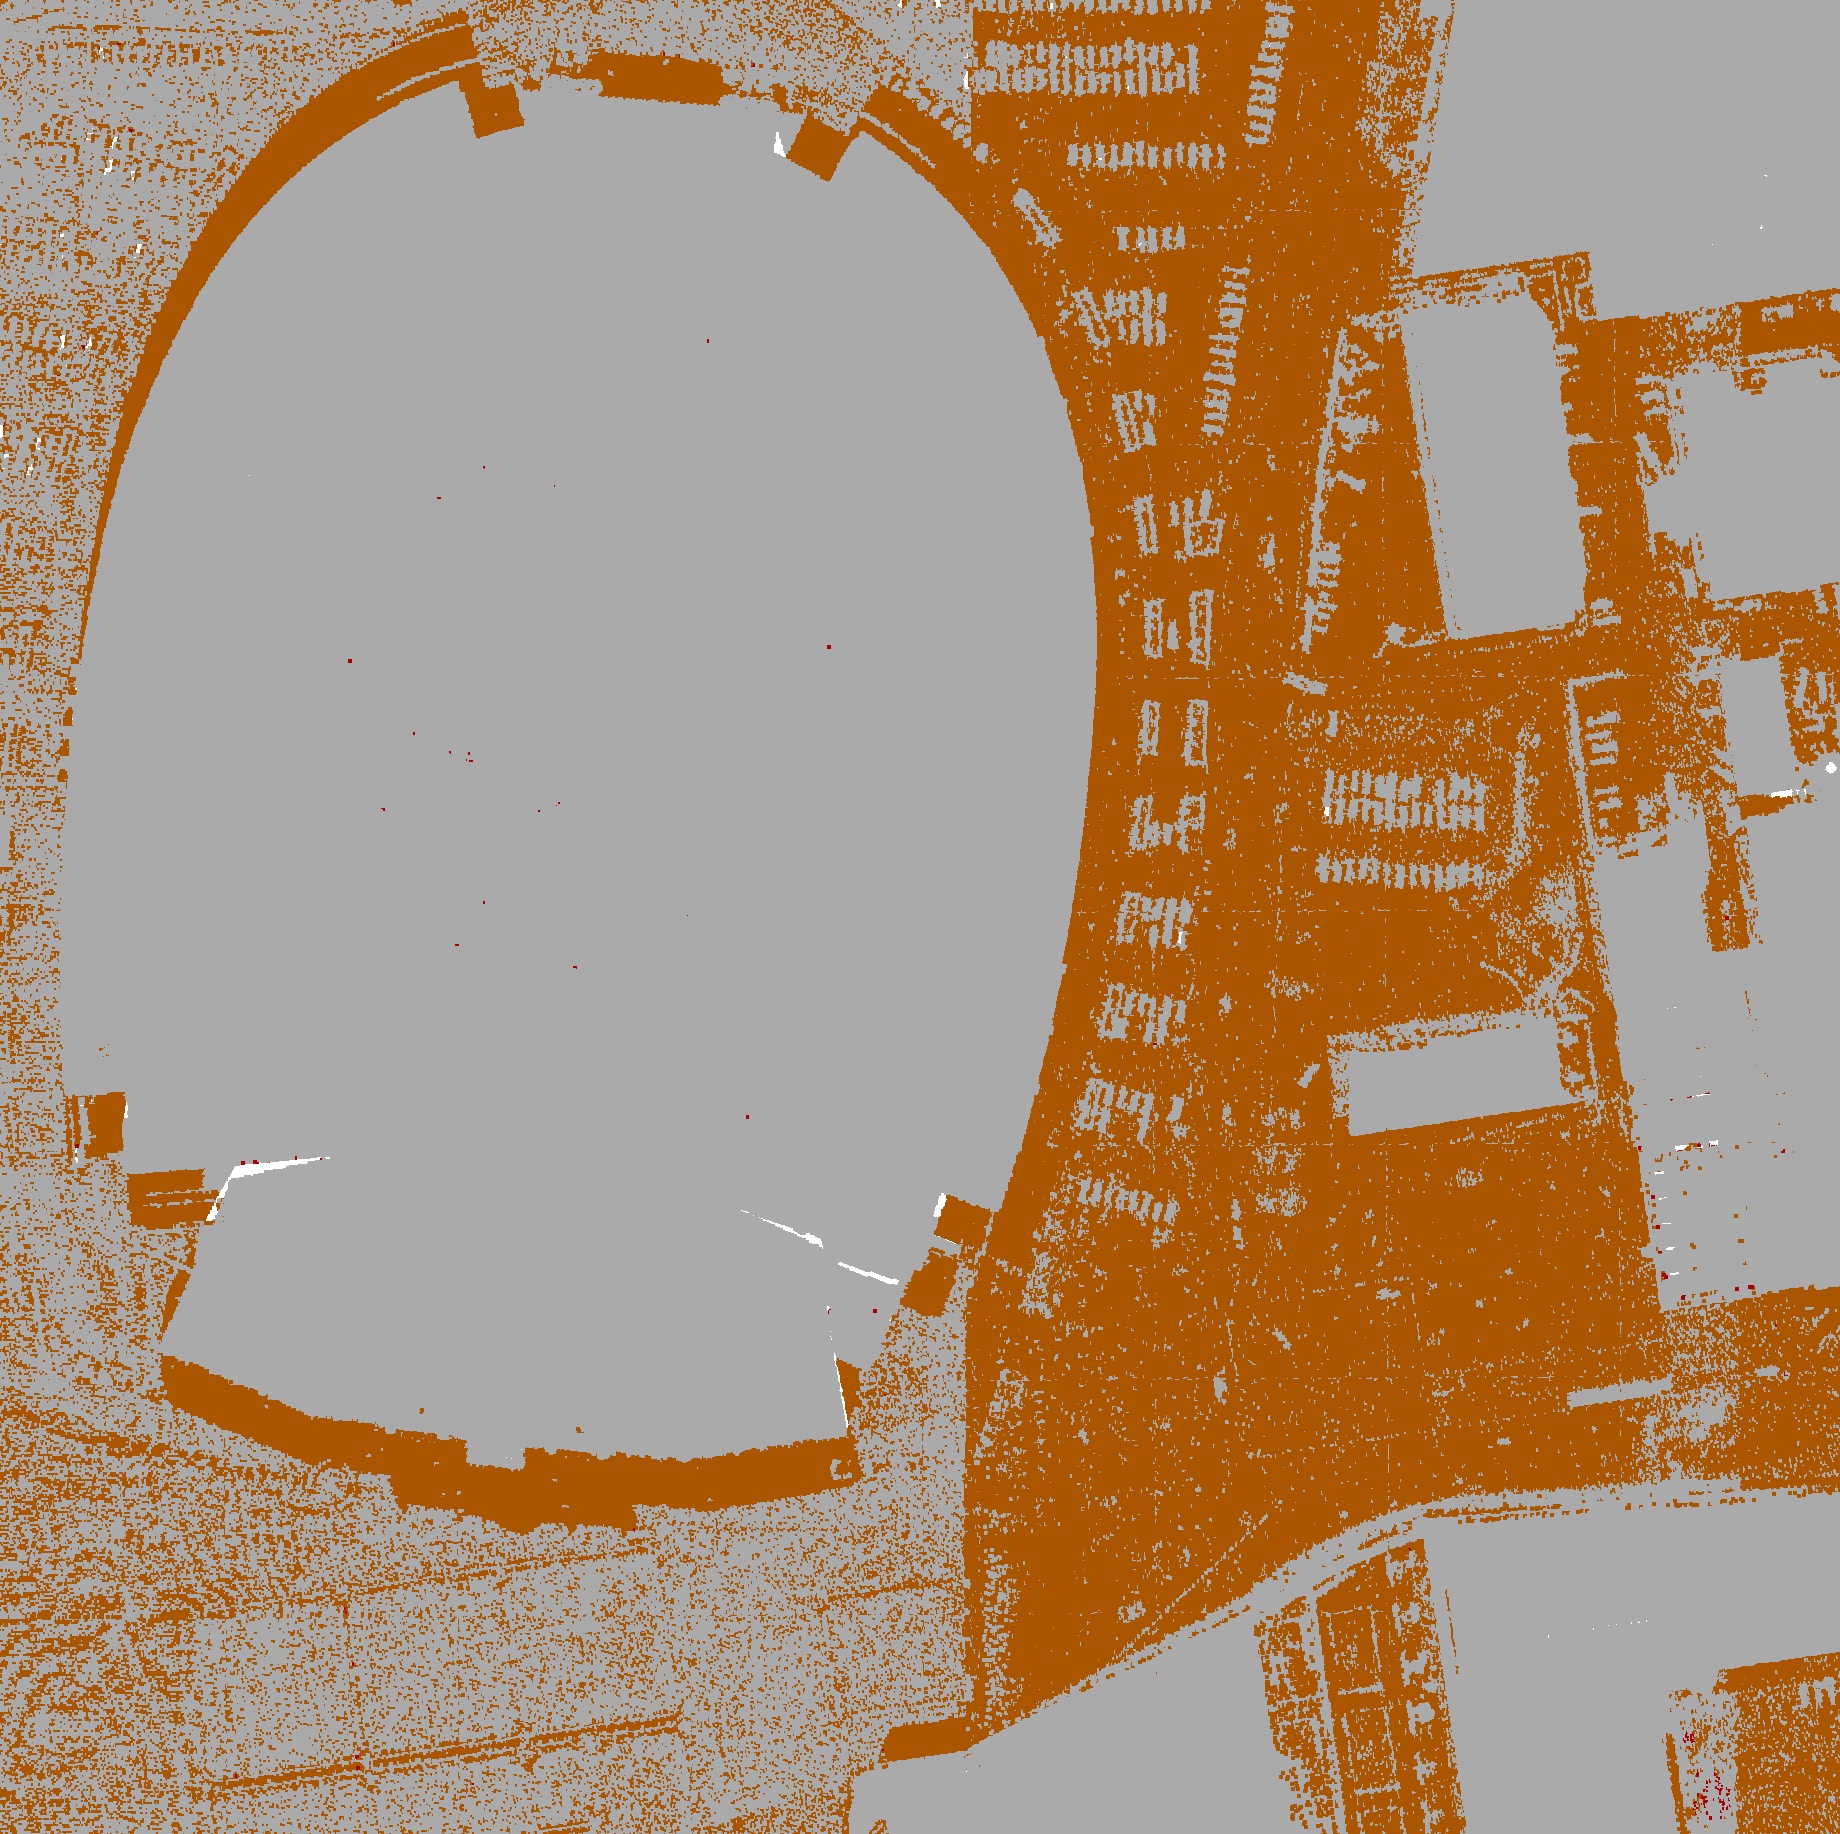
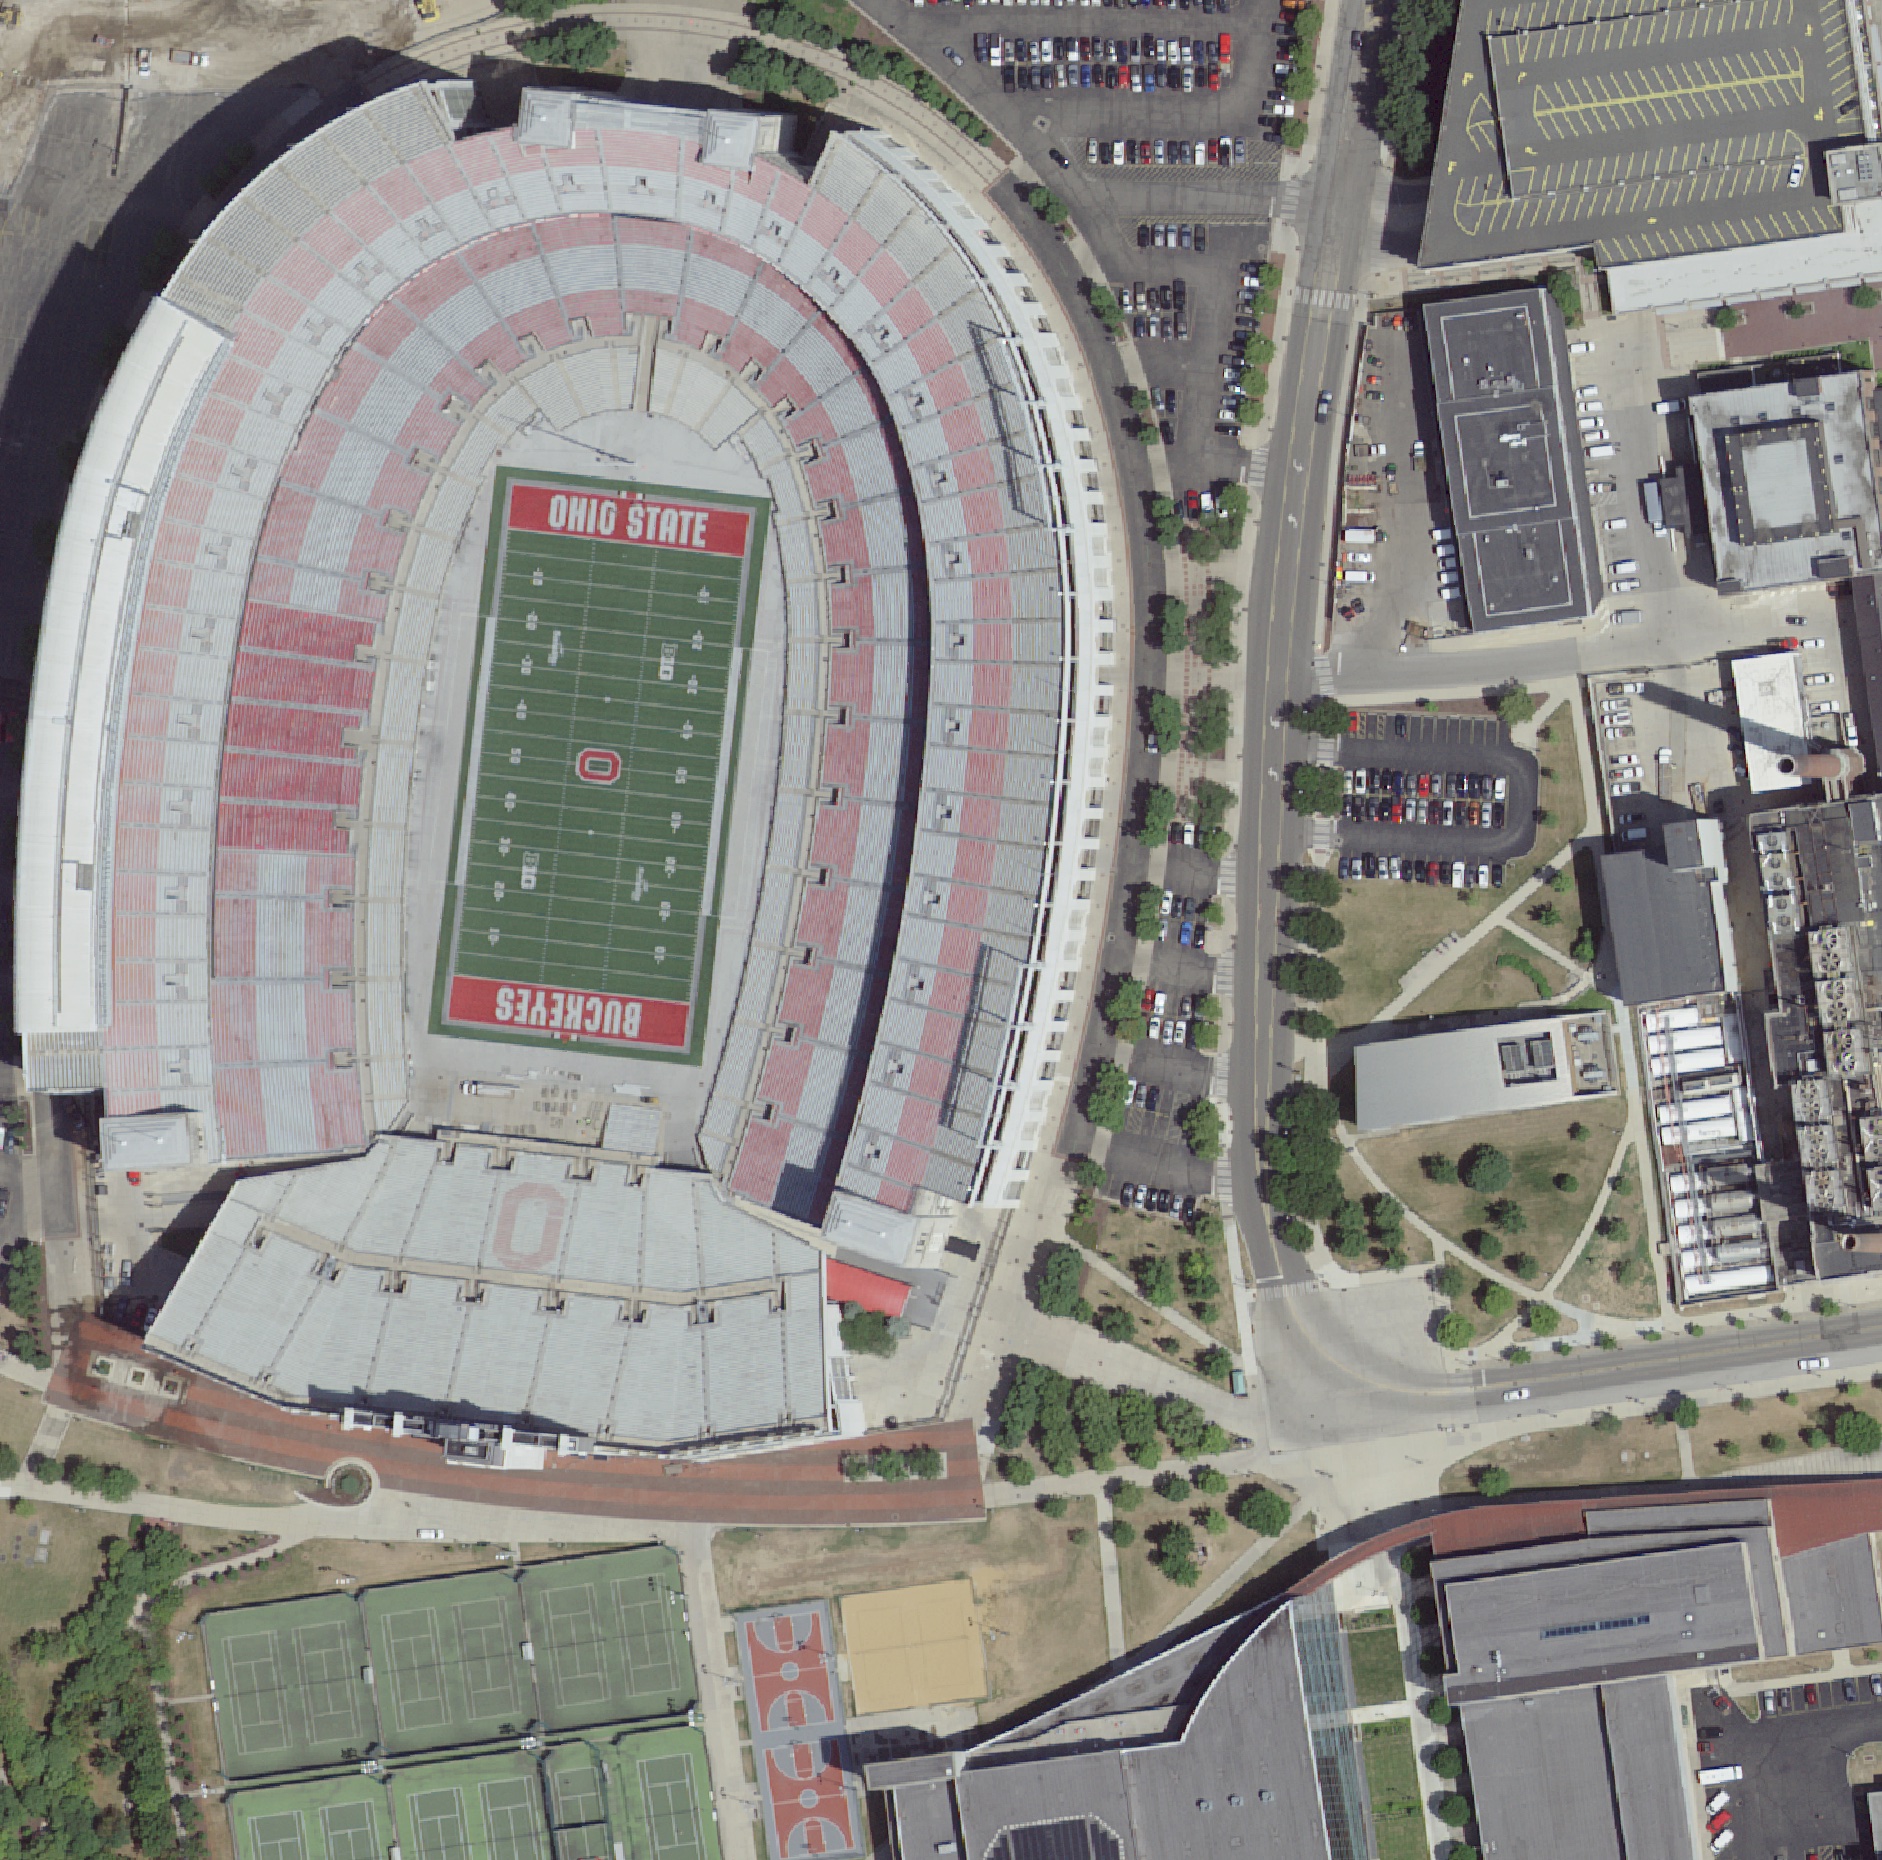
For simplicity we will rename the laz file to input.laz and the tiff file to ortho.tif.
|
In order to ensure the imagery will color the lidar correctly, we need to verify the EPSG code for each dataset. For the LiDAR data, we can use PDAL:
|
This will export a large amount of metadata about the LAS file, but in this case we are interested only in the cartesion coordinate system.
|
Assuming we have gdal installed, we can check the EPSG code of the orthoimage (TIFF file), using gdalinfo:
|
|
In this instance the two coordinate systems are very close - which can be verified by overlaying the two in QGIS and checking if there are any discrepancies when using the default transformation, or see if there are any transformations present at all.
Now that we know our two datasets will align in the same coordinate system, we need to create a PDAL pipeline file to colorize the point cloud and transform it into Web Mercator. We will also force the las file into version 1.3 so it is compatible with gocesiumtiler. To do this, create a PDAL pipeline JSON file with the following content:
|
Save this as pipeline.json, then run the pipeline with PDAL:
|
Now that we have the colorized LiDAR data in Web Mercator, we can use gocesiumtiler to create 3D tiles.
|
To clamp the tiles to the ground, retrieve the minimum elevation from the las file using PDAL:
|
|
Look for the minimum value under the Z dimension in the output. Use this value to clamp the tiles to the ground using the -z flag:
|
The –8-bit flag reads the colors in 8bit color space, which you may omit depending on your data sources. For all options see the documentation.
Finally, now that we have our 3D TIles, we can load them into a web map. The following code snippet demonstrates how to view the 3D tiles with deck.gl:
|
Here is the final result:
